Prague City Hall has launched a new website to bring together information about the city in eight categories.
The new website Pragozor.cz lets people discover verified statistics about the city in a simple and comprehensible form. The image of the Golem, a legendary figure of the city, will guide website visitors through various areas of city life — health, housing, environment, public transport, cars, safety, mobility, and tourism. The health section includes data on the current situation with coronavirus.
“The smart city is data-driven. I am glad that now we can offer this useful data to all Praguers in one place. We live in a time of frequent dissemination of misinformation and fake news, so I perceive it as a big plus that all information on Pragozor is verified, and that website visitors can click through to the sources of information,” Prague Mayor Zdeněk Hřib (Pirates) said.
“This is also practical for enthusiasts and professionals who want to study data about Prague in more depth. However, the website itself is designed to be popular and educational, and working with it is also fun thanks to its playful design. See for yourself,” he added.
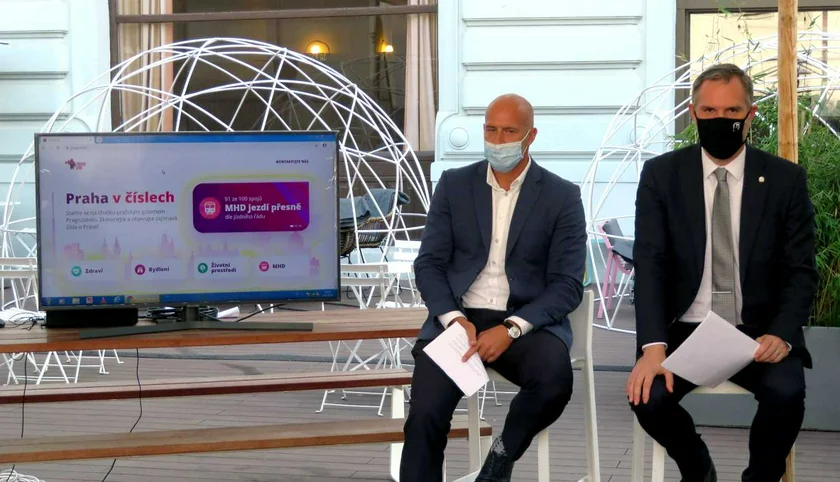
The site is in Czech, but automatic online translating tools work well with it — except that “MHD” for public transit (městská hromadná doprava) comes out as “Best before,” probably mistaken for the German expiration date term Mindesthaltbarkeitsdatum.
The housing section, for example, has yearly comparisons of flat prices Berlin, Vienna, Warsaw, Prague and Budapest. There are also figures on the rise of flat prices in Prague over the past decade and on the number of flats completed each year.
Health might be of most interest to people. It has extensive figures on COVID-19 as well as overall statistics on the number of emergency calls per year, response time, and international comparisons on access to health care.
Tourism has overall figures on spending ans well as a section on the development of shared accommodation. The environment section has data on water consumption and waste. Safety has not only crime statistics, but also info on firefighting. The sections on cars, mobility, and public transit all cover various aspects of getting around the city.
"The Pragozor website contains a total of 115 graphics. Forty of them are active, based on live data, which is updated at regular intervals. Fifteen graphs are thematically illustrated. Pragozor processes data from traffic sensors, the PID Lítačka application, Smart Prague Index, as well as parking garages, police statistics, the Czech Hydrometeorological Institute and statistical yearbooks. It often also offers international comparisons,” Operátor ICT director Michal Fišer said.

The current content of the website is not final. Operátor ICT wants to continue adding more data that will be gradually released, for example, from the Prague Public Transit Company (DPP) or on the basis of demand from users.
“I am pleased to expand the reach of the Golemio data platform and bring it closer to people. In Brno, they already have a similar project called Data.brno.cz, and in Prague we also wanted to convey our data in an easy-to-understand form. However, we definitely surpassed Brno in the quality of web design. I am excited about the beautiful graphics of Pragozor, thanks to which the project will be attractive for everyone, including students and children,” Jaromír Beránek, chairman of the IT and Smart City Committee of the Prague City Council, said.
“I believe that even little Praguers will be able to get acquainted in more detail with the functioning of our city, either on their own or with the help of parents and teachers,” he added.
Pragozor is a project of the municipal company Operátor ICT and its data platform Golemio.
Some of the facts that can be found on the site include:
- 91% of Prague's public transport connections run on time according to the timetable.
- The number of registered cars in Prague is almost equal to the number of city inhabitants.
- In the first half of 2020, twice as many flats were repaired as in the same period of 2019.
- Property crime in Prague decreased by almost half compared to 2013.
- In 2019 Prague planted 197,842 new trees.


 Reading time: 3 minutes


